

Introduction
Gartner ranks hyperautomation [link] as 1st among top 10 strategic technology trends in 2020. In the following years we expect more and more tasks that required human intervention once, to be automated or semi-automated, whether it is DevOps, Security, Networks or even other business operational areas like Sales.
Streaming events from monitoring platforms like Datadog, Splunk or Sumologic are tied to a remediation action to make your IT Operations autonomous!
Here at Botprise we develop a framework for automating your routines with simple, but powerful SmartWorkflows and SmartBots. Botprise provides both agent-based and agentless options for remediating your system(s). All workflows are event based and we have a separate tab on our platform for monitoring events.
Today we are going to describe our vision, what is done and what is our roadmap for this part of the platform. When you login to the Botprise platform, click on the left panel on “Event” and you will be directed to the events dashboard.
Events page
What information is displayed on the Events Page?
To display analytics related events, there is a separate tab on the Botprise platform, named “Events Page”. There are 3 main components on this page (going from top to bottom):
- Events Drift Component
- Events Count Component
- Events Table
Events Drift component

Chart shows graphical summary for anomalies from last 7 days.
horizontal position: date (one position per day, 1 week totally)
vertical position: average drift of daily events per host (drift in this context represents the amount of deviation from the historical median). All events per each host arithmetically averaged and displayed as 1 point. Note: above 100% drift, heights of points are significantly scaled down in order to fit the chart. It means that 1000% drift will be just slightly higher than 500% which itself will be slightly above 100%.
color: each color represents separate host
Events Count component
This tab is a stacked bar chart. Height of each full bar represents the number of events per given day (day is shown on horizontal axis), while colors show proportion of events by each host (each color represents a separate host).

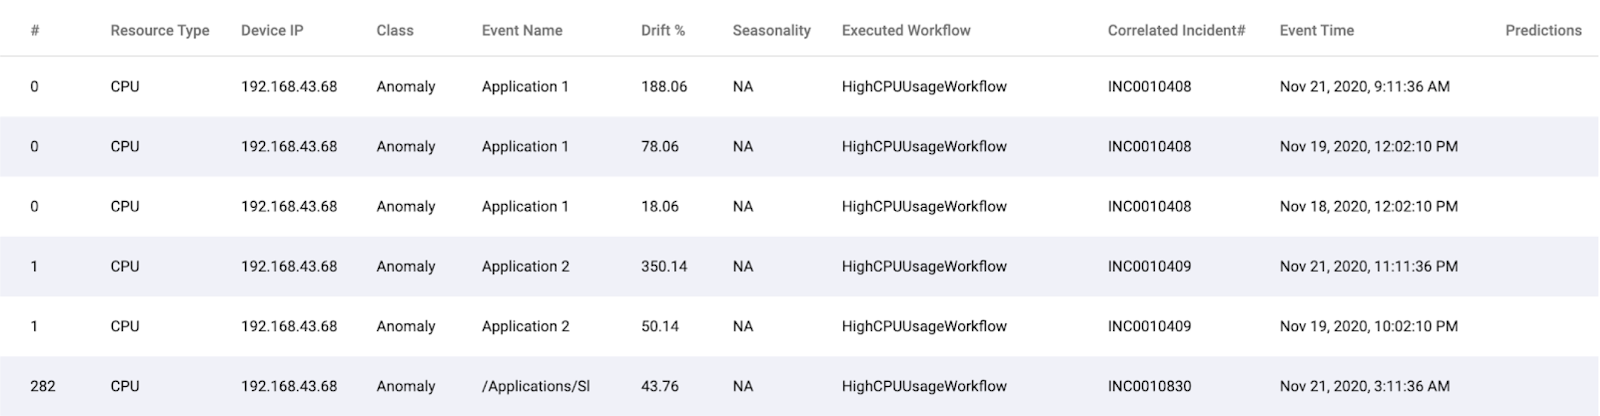
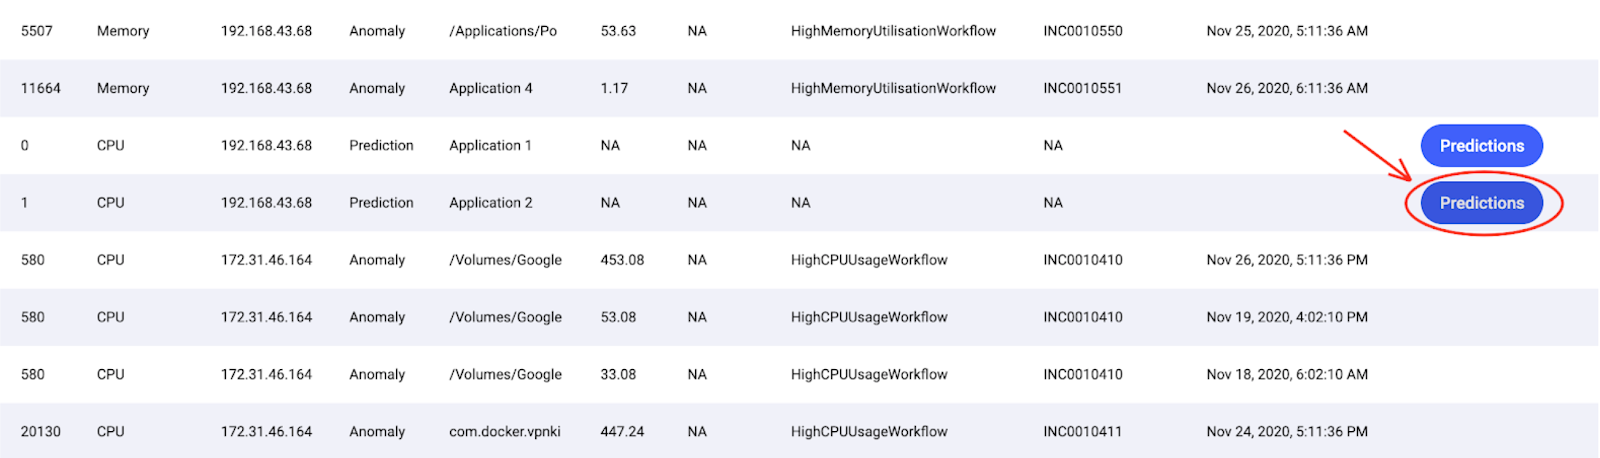
Events Table
There are currently 2 types of events on the page – anomalous events and prediction events. Each row in the table corresponds to one event. Following information about each event is presented:
| # | application id |
| Resource Type: | type of resource that is monitored (e.g. CPU, memory, network utilization and other parameters). |
| Device IP: | Device IP |
| Class: | currently, there are 2 classes of events – Anomaly and Prediction |
| Event Name: | extended description of event, associated entity (application name, system partition, interface, IP address etc.) |
| Drift%: | deviation of value from historical median |
| Seasonality: | if event (anomaly) is detected to be periodic |
| Executed workflow: | Botprise’s workflow executed after event |
| Correlated incident: | id of corresponding itsm ticket (created as a part of workflow or detected as related by DU) |
| Event Time: | time when event occurred |
| Prediction: | link to pop-up with forecast plot (only for Prediction events) |
Anomaly
Anomaly is defined as deviation of the system from a normal state.
With Machine Learning empowered Decisions Units, Botprise provides capability to detect it automatically, with no human intervention. There are several available algorithms and user could choose the best algorithm for her use-case or choose an auto-selection of algorithm.
Prediction
Prediction is a forecast of future values of some quantity (user choose which) based on historical data. Several algorithms as well as autoselection are available for user. Full list of available algorithms for different tasks you could check at DS in Botprise .
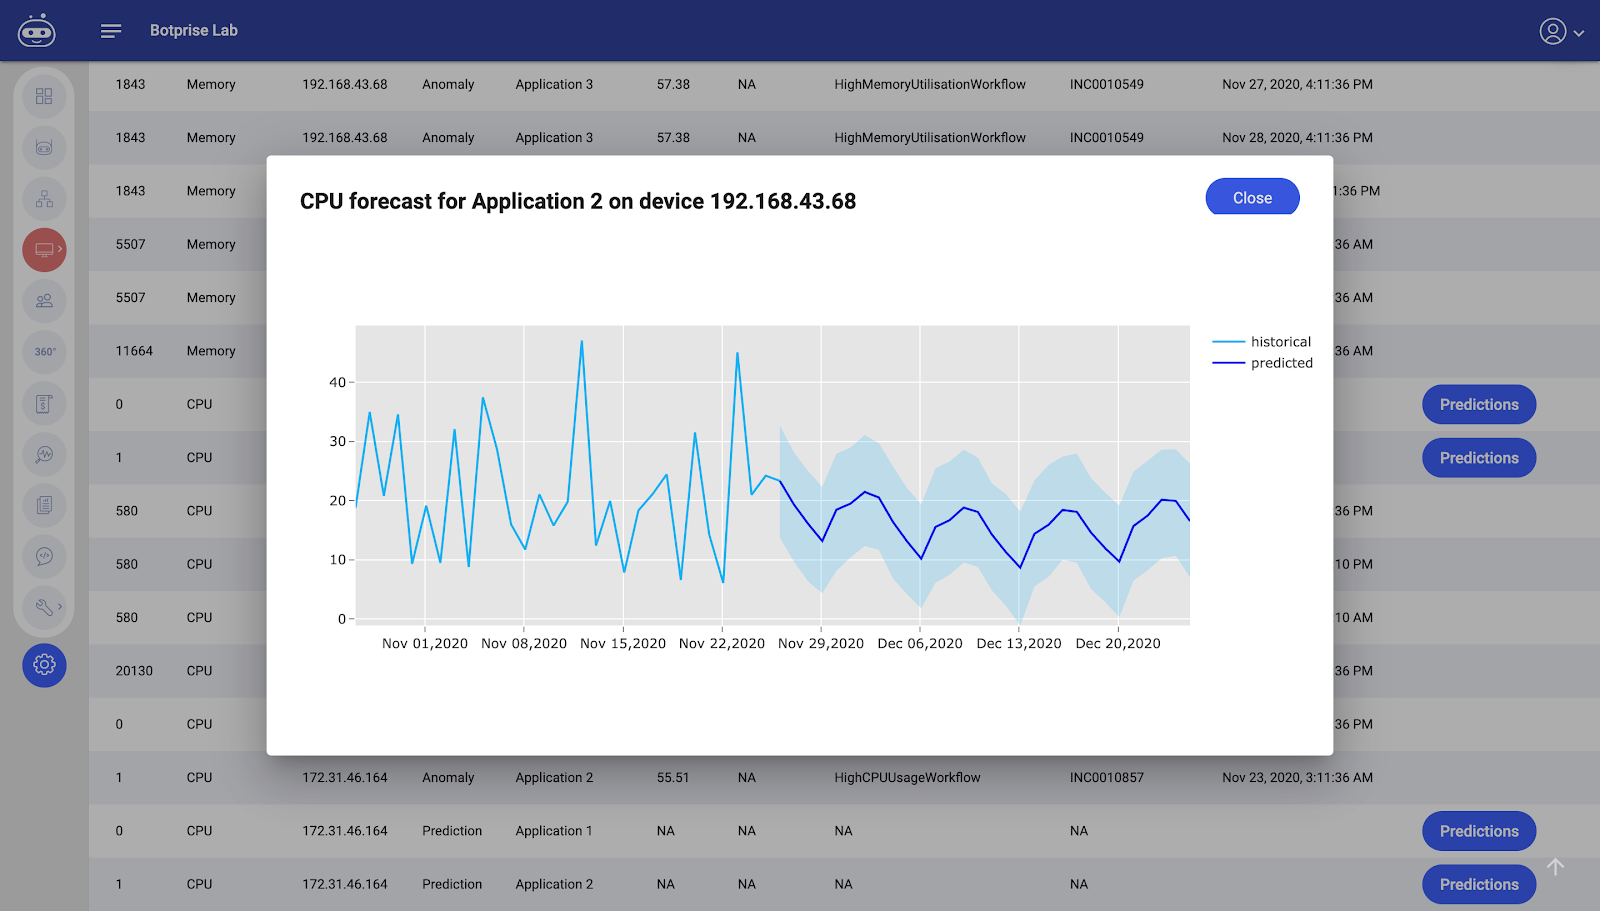
Prediction button
For table rows with predictions, click on the “Prediction” button and a chart with forecast will appear. Horizontal position represents time, vertical – value. Light blue line is historical data from the last month and dark blue line is predictions for the next month. Shaded intervals – are 0.95 uncertainty intervals for forecasts (i.e., intervals within which, according to the model, data will lie in 95 cases out of 100)
Example of pop-up from Predictions Button
Conclusions
Today we have gone through our Events page and described what functionality is there. Note, that this is only a small part of our platform and also we are at the very beginning of our journey in the Automation field.
We are building our platform in the way that you could feed events information downstream and build workflow centered around monitoring and forecasting data. Just a couple examples:
- Anomalies detected by DUs are fed to AUs that kills or restarts anomalous processes
- Forecasts of workload are feed to AUs that scales out or scales in you infrastructure before your system actually encounters high load
These are only 2 examples, but it will be pretty easy to set up a couple of dozens of workflows that could automate your enterprise and save thousands or even millions of dollars for you in the long run.
We are planning to:
- Improve our Events Drift tab with more granular time intervals (currently intervals equal to 1 day) and additional dimension, such as bubble size to show events clusters.
- Add more event types. There would be different types of events for device monitoring, networks, cloud, security etc. We also plan to add events such as model retraining; if Bot has taken some action; and other.
- Add other interactive components to the Events page for analysing and getting insights from your events.
If you liked what we have done or if you have suggestions or even if you have some specific automation use case – contact us! We are happy to extend our automation solution to your use case and make your team happy as well!